Even the most spectacularly preserved fossils, with soft tissues ‘petrified’ as the product of a complex interplay of biological and geological processes, have experienced alterations that distort palaeontological reconstructions. Many works have now emphasized the need to precisely constrain these processes prevailing during fossilization, and circumvent potential biases. Nonetheless our knowledge is essentially limited to the biological controls occurring in the first days to months after the death of an organism, as revealed by decay experiments in the laboratory, but the geological processes remain largely unknown. Particularly, the mineralogical nature of fossils is rarely investigated, or mostly through their elemental composition.
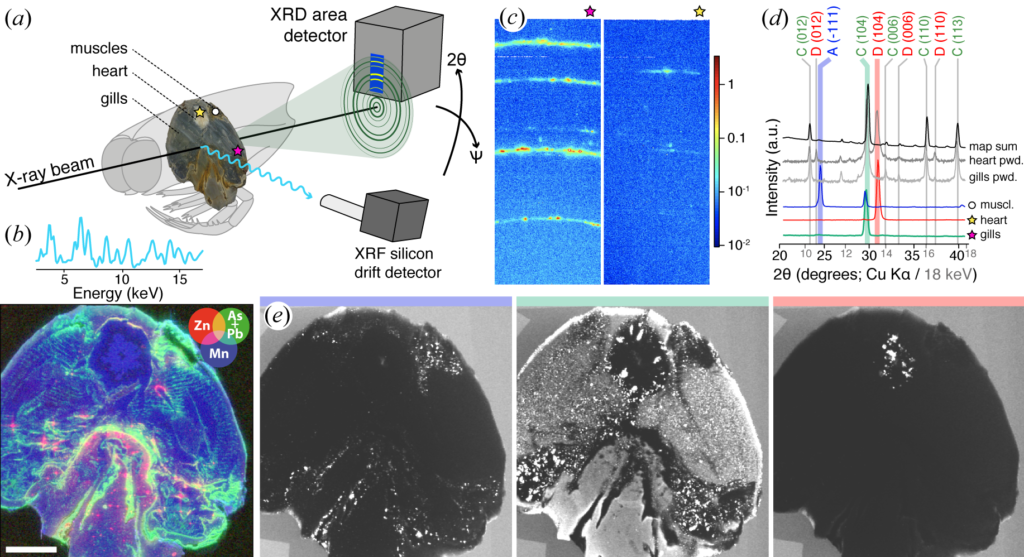
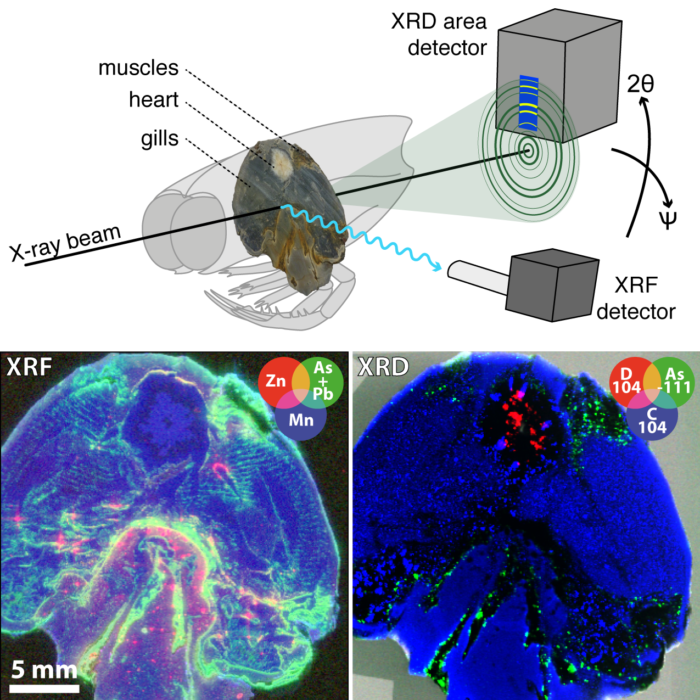
In a manuscript submitted today to the Journal of the Royal Society Interface, also deposited as a preprint on the paleorXiv portal, my collaborators and myself describe a novel synchrotron imaging approach to generating megapixel mineralogical maps across millimeter-thick cross-sections through fossils and pluri-centimeter-large flat fossils. Referred to as “synchronous synchrotron rapid scanning X-ray fluorescence and diffraction mapping (SRS-XRFD)”, it allows for mineral phases identification and localization at the microscale over centimetric lateral size objects, and further gives information on texture (preferential orientation), crystallites size and local strain, showing great potential for taphonomic studies, as well as other poorly understood (bio)mineralization processes in life and environmental sciences. We also illustrate that mineralogical contrasts between fossil tissues and/or the encasing sedimentary matrix can be used to visualize hidden anatomies in fossils.